|
Download Data (XLS File) |
|
|||||
|
|||||
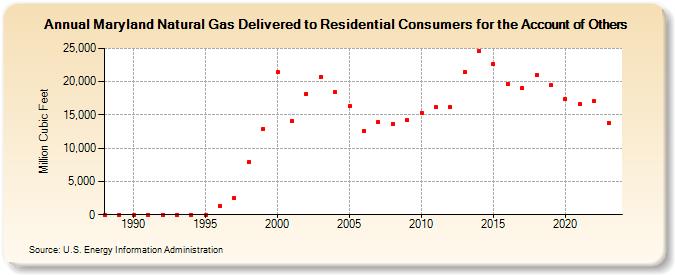
| Maryland Natural Gas Delivered to Residential Consumers for the Account of Others (Million Cubic Feet) | |||||
| Decade | Year-0 | Year-1 | Year-2 | Year-3 | Year-4 | Year-5 | Year-6 | Year-7 | Year-8 | Year-9 |
|---|---|---|---|---|---|---|---|---|---|---|
| 1980's | 0 | 0 | ||||||||
| 1990's | 0 | 0 | 0 | 0 | 0 | 0 | 1,338 | 2,503 | 7,920 | 12,920 |
| 2000's | 21,410 | 14,133 | 18,168 | 20,723 | 18,441 | 16,277 | 12,647 | 13,967 | 13,677 | 14,262 |
| 2010's | 15,310 | 16,119 | 16,189 | 21,457 | 24,643 | 22,658 | 19,683 | 18,994 | 20,996 | 19,446 |
| 2020's | 17,351 | 16,571 | 17,044 | 13,819 | 13,258 |
| - = No Data Reported; -- = Not Applicable; NA = Not Available; W = Withheld to avoid disclosure of individual company data. |
| Release Date: 6/30/2026 |
| Next Release Date: 7/31/2026 |