|
Download Data (XLS File) |
|
|||||
|
|||||
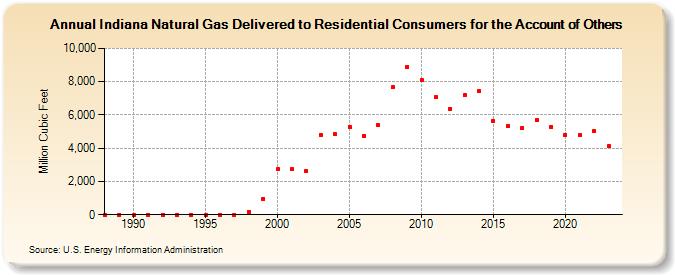
| Indiana Natural Gas Delivered to Residential Consumers for the Account of Others (Million Cubic Feet) | |||||
| Decade | Year-0 | Year-1 | Year-2 | Year-3 | Year-4 | Year-5 | Year-6 | Year-7 | Year-8 | Year-9 |
|---|---|---|---|---|---|---|---|---|---|---|
| 1980's | 0 | 0 | ||||||||
| 1990's | 0 | 0 | 0 | 0 | 0 | 0 | 0 | 0 | 179 | 968 |
| 2000's | 2,736 | 2,740 | 2,638 | 4,813 | 4,841 | 5,293 | 4,748 | 5,379 | 7,655 | 8,909 |
| 2010's | 8,101 | 7,072 | 6,375 | 7,186 | 7,412 | 5,633 | 5,359 | 5,238 | 5,722 | 5,291 |
| 2020's | 4,821 | 4,799 | 5,034 | 4,128 | 3,689 |
| - = No Data Reported; -- = Not Applicable; NA = Not Available; W = Withheld to avoid disclosure of individual company data. |
| Release Date: 6/30/2026 |
| Next Release Date: 7/31/2026 |