|
Download Data (XLS File) |
|
|||||
|
|||||
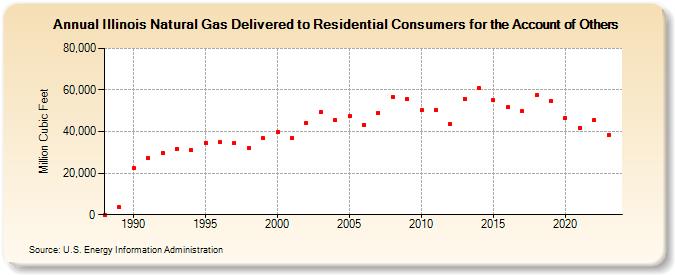
| Illinois Natural Gas Delivered to Residential Consumers for the Account of Others (Million Cubic Feet) | |||||
| Decade | Year-0 | Year-1 | Year-2 | Year-3 | Year-4 | Year-5 | Year-6 | Year-7 | Year-8 | Year-9 |
|---|---|---|---|---|---|---|---|---|---|---|
| 1980's | 0 | 3,497 | ||||||||
| 1990's | 22,412 | 27,326 | 29,783 | 31,795 | 31,119 | 34,652 | 34,758 | 34,653 | 32,068 | 36,689 |
| 2000's | 39,670 | 36,865 | 44,221 | 49,325 | 45,648 | 47,418 | 43,317 | 49,096 | 56,757 | 55,468 |
| 2010's | 50,191 | 50,373 | 43,538 | 55,830 | 60,750 | 54,983 | 51,632 | 49,744 | 57,561 | 54,632 |
| 2020's | 46,604 | 41,899 | 45,661 | 38,328 | 35,053 |
| - = No Data Reported; -- = Not Applicable; NA = Not Available; W = Withheld to avoid disclosure of individual company data. |
| Release Date: 6/30/2026 |
| Next Release Date: 7/31/2026 |