|
Download Data (XLS File) |
|
|||||
|
|||||
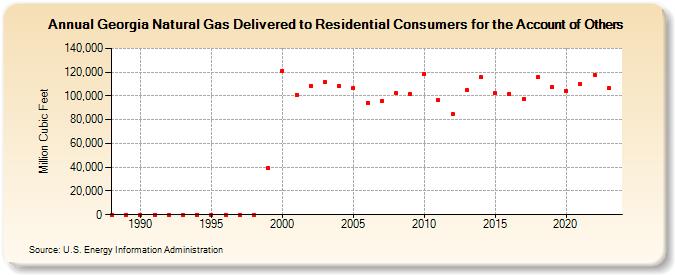
| Georgia Natural Gas Delivered to Residential Consumers for the Account of Others (Million Cubic Feet) | |||||
| Decade | Year-0 | Year-1 | Year-2 | Year-3 | Year-4 | Year-5 | Year-6 | Year-7 | Year-8 | Year-9 |
|---|---|---|---|---|---|---|---|---|---|---|
| 1980's | 0 | 0 | ||||||||
| 1990's | 0 | 0 | 0 | 0 | 0 | 0 | 0 | 0 | 74 | 39,351 |
| 2000's | 121,371 | 100,978 | 108,676 | 111,498 | 108,356 | 106,486 | 94,041 | 95,839 | 102,148 | 101,830 |
| 2010's | 118,838 | 96,263 | 84,475 | 104,674 | 115,603 | 102,036 | 101,789 | 97,696 | 115,776 | 107,253 |
| 2020's | 104,450 | 109,756 | 117,984 | 106,569 | 115,124 |
| - = No Data Reported; -- = Not Applicable; NA = Not Available; W = Withheld to avoid disclosure of individual company data. |
| Release Date: 6/30/2026 |
| Next Release Date: 7/31/2026 |