|
Download Data (XLS File) |
|
|||||
|
|||||
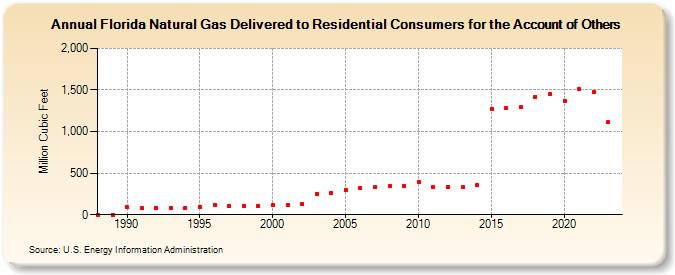
| Florida Natural Gas Delivered to Residential Consumers for the Account of Others (Million Cubic Feet) | |||||
| Decade | Year-0 | Year-1 | Year-2 | Year-3 | Year-4 | Year-5 | Year-6 | Year-7 | Year-8 | Year-9 |
|---|---|---|---|---|---|---|---|---|---|---|
| 1980's | 0 | 0 | ||||||||
| 1990's | 87 | 81 | 82 | 85 | 85 | 92 | 118 | 104 | 104 | 109 |
| 2000's | 114 | 119 | 128 | 253 | 267 | 301 | 320 | 333 | 346 | 344 |
| 2010's | 398 | 328 | 331 | 333 | 358 | 1,275 | 1,280 | 1,295 | 1,419 | 1,447 |
| 2020's | 1,372 | 1,514 | 1,477 | 1,109 | 1,495 |
| - = No Data Reported; -- = Not Applicable; NA = Not Available; W = Withheld to avoid disclosure of individual company data. |
| Release Date: 6/30/2026 |
| Next Release Date: 7/31/2026 |