|
Download Data (XLS File) |
|
|||||
|
|||||
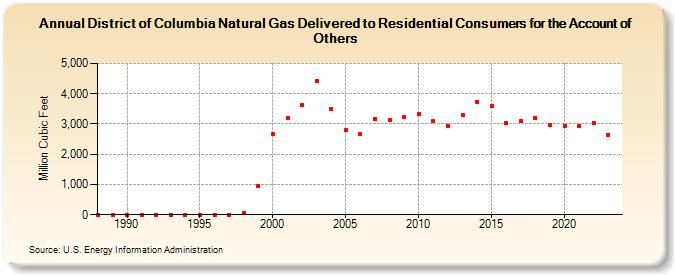
| District of Columbia Natural Gas Delivered to Residential Consumers for the Account of Others (Million Cubic Feet) | |||||
| Decade | Year-0 | Year-1 | Year-2 | Year-3 | Year-4 | Year-5 | Year-6 | Year-7 | Year-8 | Year-9 |
|---|---|---|---|---|---|---|---|---|---|---|
| 1980's | 0 | 0 | ||||||||
| 1990's | 0 | 0 | 0 | 0 | 0 | 0 | 0 | 0 | 52 | 964 |
| 2000's | 2,653 | 3,187 | 3,637 | 4,435 | 3,506 | 2,804 | 2,659 | 3,178 | 3,132 | 3,222 |
| 2010's | 3,329 | 3,099 | 2,934 | 3,302 | 3,735 | 3,609 | 3,045 | 3,106 | 3,200 | 2,953 |
| 2020's | 2,933 | 2,942 | 3,032 | 2,650 | 2,835 |
| - = No Data Reported; -- = Not Applicable; NA = Not Available; W = Withheld to avoid disclosure of individual company data. |
| Release Date: 6/30/2026 |
| Next Release Date: 7/31/2026 |