|
Download Data (XLS File) |
|
|||||
|
|||||
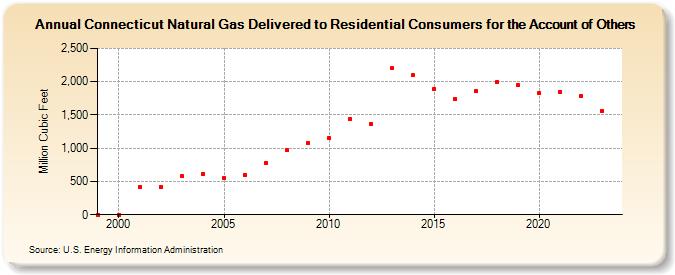
| Connecticut Natural Gas Delivered to Residential Consumers for the Account of Others (Million Cubic Feet) | |||||
| Decade | Year-0 | Year-1 | Year-2 | Year-3 | Year-4 | Year-5 | Year-6 | Year-7 | Year-8 | Year-9 |
|---|---|---|---|---|---|---|---|---|---|---|
| 1990's | 0 | |||||||||
| 2000's | 0 | 423 | 422 | 579 | 610 | 555 | 596 | 780 | 967 | 1,080 |
| 2010's | 1,156 | 1,438 | 1,364 | 2,199 | 2,096 | 1,891 | 1,740 | 1,858 | 1,988 | 1,947 |
| 2020's | 1,829 | 1,846 | 1,786 | 1,563 | 1,435 |
| - = No Data Reported; -- = Not Applicable; NA = Not Available; W = Withheld to avoid disclosure of individual company data. |
| Release Date: 6/30/2026 |
| Next Release Date: 7/31/2026 |