|
Download Data (XLS File) |
|
|||||
|
|||||
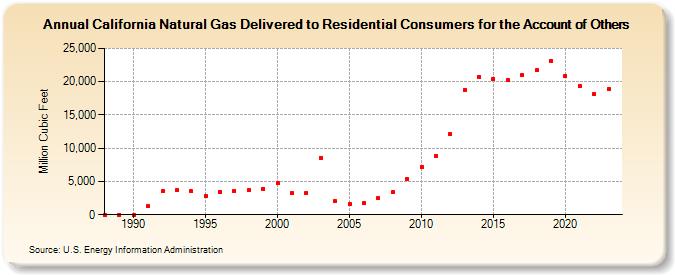
| California Natural Gas Delivered to Residential Consumers for the Account of Others (Million Cubic Feet) | |||||
| Decade | Year-0 | Year-1 | Year-2 | Year-3 | Year-4 | Year-5 | Year-6 | Year-7 | Year-8 | Year-9 |
|---|---|---|---|---|---|---|---|---|---|---|
| 1980's | 0 | 0 | ||||||||
| 1990's | 0 | 1,256 | 3,502 | 3,700 | 3,507 | 2,848 | 3,472 | 3,623 | 3,699 | 3,921 |
| 2000's | 4,783 | 3,298 | 3,271 | 8,564 | 2,002 | 1,633 | 1,723 | 2,446 | 3,357 | 5,400 |
| 2010's | 7,205 | 8,769 | 12,108 | 18,795 | 20,703 | 20,450 | 20,192 | 20,989 | 21,713 | 23,133 |
| 2020's | 20,838 | 19,323 | 18,138 | 18,873 | 17,226 |
| - = No Data Reported; -- = Not Applicable; NA = Not Available; W = Withheld to avoid disclosure of individual company data. |
| Release Date: 6/30/2026 |
| Next Release Date: 7/31/2026 |