|
Download Data (XLS File) |
|
|||||
|
|||||
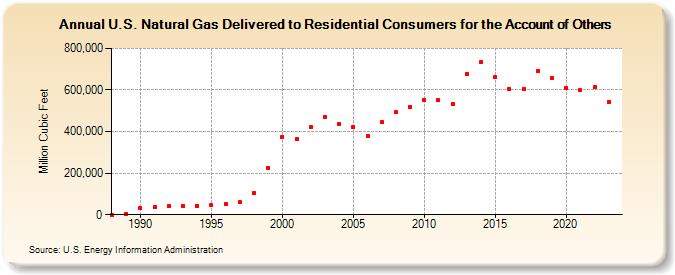
| U.S. Natural Gas Delivered to Residential Consumers for the Account of Others (Million Cubic Feet) | |||||
| Decade | Year-0 | Year-1 | Year-2 | Year-3 | Year-4 | Year-5 | Year-6 | Year-7 | Year-8 | Year-9 |
|---|---|---|---|---|---|---|---|---|---|---|
| 1980's | 0 | 3,497 | ||||||||
| 1990's | 31,302 | 36,440 | 41,433 | 44,314 | 42,338 | 45,269 | 49,148 | 61,013 | 105,128 | 225,198 |
| 2000's | 371,972 | 361,903 | 423,754 | 472,315 | 435,536 | 421,124 | 378,974 | 444,010 | 491,940 | 519,466 |
| 2010's | 552,116 | 550,444 | 534,298 | 676,657 | 733,941 | 661,585 | 604,272 | 605,105 | 691,808 | 656,745 |
| 2020's | 607,816 | 597,685 | 612,320 | 544,040 | 532,042 |
| - = No Data Reported; -- = Not Applicable; NA = Not Available; W = Withheld to avoid disclosure of individual company data. |
| Release Date: 6/30/2026 |
| Next Release Date: 7/31/2026 |