|
Download Data (XLS File) |
|
|||||
|
|||||
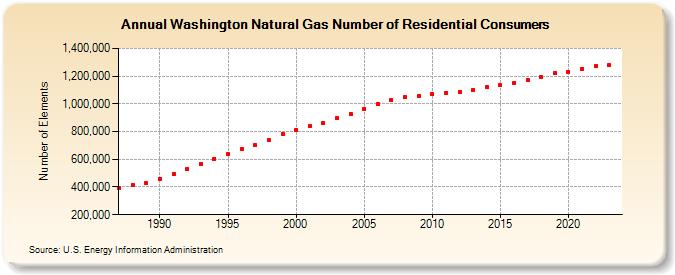
| Washington Natural Gas Number of Residential Consumers (Number of Elements) | |||||
| Decade | Year-0 | Year-1 | Year-2 | Year-3 | Year-4 | Year-5 | Year-6 | Year-7 | Year-8 | Year-9 |
|---|---|---|---|---|---|---|---|---|---|---|
| 1980's | 392,469 | 413,008 | 425,624 | |||||||
| 1990's | 458,013 | 492,189 | 528,913 | 565,475 | 604,315 | 638,603 | 673,357 | 702,701 | 737,208 | 779,104 |
| 2000's | 813,319 | 841,617 | 861,943 | 895,800 | 926,510 | 966,199 | 997,728 | 1,025,171 | 1,047,319 | 1,059,239 |
| 2010's | 1,067,979 | 1,079,277 | 1,088,762 | 1,102,318 | 1,118,193 | 1,133,629 | 1,153,183 | 1,173,994 | 1,194,375 | 1,220,197 |
| 2020's | 1,232,852 | 1,251,963 | 1,271,260 | 1,279,608 | 1,287,447 |
| - = No Data Reported; -- = Not Applicable; NA = Not Available; W = Withheld to avoid disclosure of individual company data. |
| Release Date: 6/30/2026 |
| Next Release Date: 7/31/2026 |