|
Download Data (XLS File) |
|
|||||
|
|||||
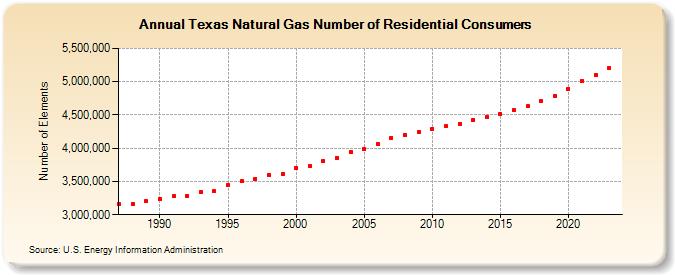
| Texas Natural Gas Number of Residential Consumers (Number of Elements) | |||||
| Decade | Year-0 | Year-1 | Year-2 | Year-3 | Year-4 | Year-5 | Year-6 | Year-7 | Year-8 | Year-9 |
|---|---|---|---|---|---|---|---|---|---|---|
| 1980's | 3,155,948 | 3,166,168 | 3,201,316 | |||||||
| 1990's | 3,232,849 | 3,274,482 | 3,285,025 | 3,346,809 | 3,350,314 | 3,446,120 | 3,501,853 | 3,543,027 | 3,600,505 | 3,613,864 |
| 2000's | 3,704,501 | 3,738,260 | 3,809,370 | 3,859,647 | 3,939,101 | 3,984,481 | 4,067,508 | 4,156,991 | 4,205,412 | 4,248,613 |
| 2010's | 4,288,495 | 4,326,156 | 4,370,057 | 4,424,103 | 4,469,282 | 4,515,690 | 4,573,047 | 4,633,561 | 4,702,609 | 4,787,135 |
| 2020's | 4,896,051 | 5,014,915 | 5,103,074 | 5,203,507 | 5,308,705 |
| - = No Data Reported; -- = Not Applicable; NA = Not Available; W = Withheld to avoid disclosure of individual company data. |
| Release Date: 6/30/2026 |
| Next Release Date: 7/31/2026 |