|
Download Data (XLS File) |
|
|||||
|
|||||
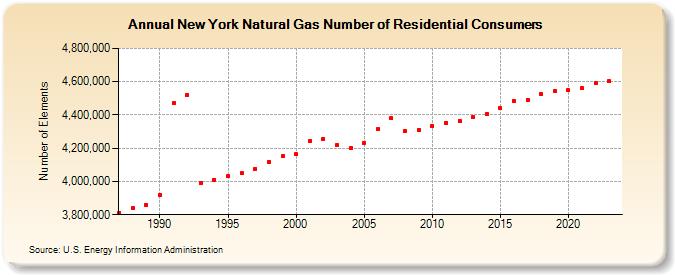
| New York Natural Gas Number of Residential Consumers (Number of Elements) | |||||
| Decade | Year-0 | Year-1 | Year-2 | Year-3 | Year-4 | Year-5 | Year-6 | Year-7 | Year-8 | Year-9 |
|---|---|---|---|---|---|---|---|---|---|---|
| 1980's | 3,810,577 | 3,839,952 | 3,859,413 | |||||||
| 1990's | 3,917,354 | 4,472,005 | 4,522,274 | 3,990,564 | 4,008,868 | 4,030,702 | 4,048,166 | 4,077,385 | 4,117,307 | 4,150,731 |
| 2000's | 4,162,450 | 4,243,130 | 4,258,205 | 4,218,180 | 4,199,456 | 4,232,374 | 4,315,203 | 4,379,937 | 4,303,342 | 4,308,592 |
| 2010's | 4,335,006 | 4,353,668 | 4,364,169 | 4,387,456 | 4,406,039 | 4,439,247 | 4,484,005 | 4,492,315 | 4,523,141 | 4,545,244 |
| 2020's | 4,547,497 | 4,559,338 | 4,589,579 | 4,601,595 | 4,617,162 |
| - = No Data Reported; -- = Not Applicable; NA = Not Available; W = Withheld to avoid disclosure of individual company data. |
| Release Date: 6/30/2026 |
| Next Release Date: 7/31/2026 |