|
Download Data (XLS File) |
|
|||||
|
|||||
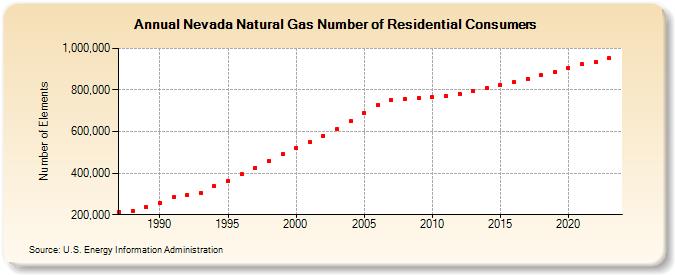
| Nevada Natural Gas Number of Residential Consumers (Number of Elements) | |||||
| Decade | Year-0 | Year-1 | Year-2 | Year-3 | Year-4 | Year-5 | Year-6 | Year-7 | Year-8 | Year-9 |
|---|---|---|---|---|---|---|---|---|---|---|
| 1980's | 213,422 | 219,981 | 236,237 | |||||||
| 1990's | 256,119 | 283,307 | 295,714 | 305,099 | 336,353 | 364,112 | 393,783 | 426,221 | 458,737 | 490,029 |
| 2000's | 520,233 | 550,850 | 580,319 | 610,756 | 648,551 | 688,058 | 726,772 | 750,570 | 758,315 | 760,391 |
| 2010's | 764,435 | 772,880 | 782,759 | 794,150 | 808,970 | 824,039 | 838,859 | 854,518 | 871,236 | 887,612 |
| 2020's | 906,016 | 922,888 | 936,598 | 951,630 | 966,710 |
| - = No Data Reported; -- = Not Applicable; NA = Not Available; W = Withheld to avoid disclosure of individual company data. |
| Release Date: 6/30/2026 |
| Next Release Date: 7/31/2026 |