|
Download Data (XLS File) |
|
|||||
|
|||||
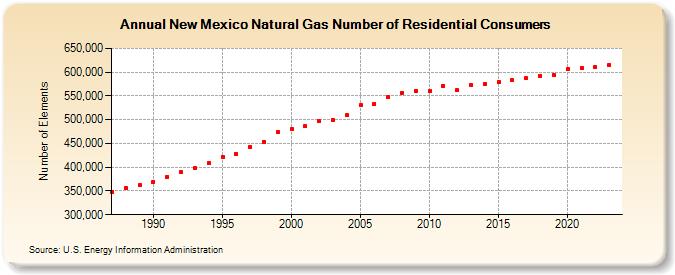
| New Mexico Natural Gas Number of Residential Consumers (Number of Elements) | |||||
| Decade | Year-0 | Year-1 | Year-2 | Year-3 | Year-4 | Year-5 | Year-6 | Year-7 | Year-8 | Year-9 |
|---|---|---|---|---|---|---|---|---|---|---|
| 1980's | 348,759 | 356,192 | 361,521 | |||||||
| 1990's | 369,451 | 379,472 | 389,063 | 397,681 | 409,095 | 421,896 | 428,621 | 443,167 | 454,065 | 473,375 |
| 2000's | 479,894 | 485,969 | 496,577 | 498,852 | 509,119 | 530,277 | 533,971 | 547,512 | 556,905 | 560,479 |
| 2010's | 559,852 | 570,637 | 561,713 | 572,224 | 574,578 | 578,769 | 582,888 | 586,688 | 592,775 | 594,859 |
| 2020's | 605,734 | 609,186 | 610,898 | 615,084 | 619,406 |
| - = No Data Reported; -- = Not Applicable; NA = Not Available; W = Withheld to avoid disclosure of individual company data. |
| Release Date: 6/30/2026 |
| Next Release Date: 7/31/2026 |