|
Download Data (XLS File) |
|
|||||
|
|||||
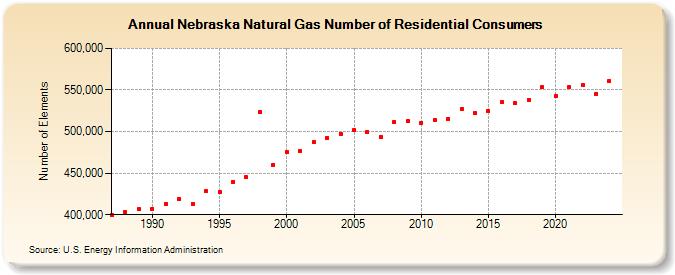
| Nebraska Natural Gas Number of Residential Consumers (Number of Elements) | |||||
| Decade | Year-0 | Year-1 | Year-2 | Year-3 | Year-4 | Year-5 | Year-6 | Year-7 | Year-8 | Year-9 |
|---|---|---|---|---|---|---|---|---|---|---|
| 1980's | 400,218 | 403,657 | 406,723 | |||||||
| 1990's | 407,094 | 413,354 | 418,611 | 413,358 | 428,201 | 427,720 | 439,931 | 444,970 | 523,790 | 460,173 |
| 2000's | 475,673 | 476,275 | 487,332 | 492,451 | 497,391 | 501,279 | 499,504 | 494,005 | 512,013 | 512,551 |
| 2010's | 510,776 | 514,481 | 515,338 | 527,397 | 522,408 | 525,165 | 535,245 | 533,844 | 538,069 | 553,265 |
| 2020's | 542,706 | 553,328 | 555,618 | 545,680 | 560,551 |
| - = No Data Reported; -- = Not Applicable; NA = Not Available; W = Withheld to avoid disclosure of individual company data. |
| Release Date: 6/30/2026 |
| Next Release Date: 7/31/2026 |