|
Download Data (XLS File) |
|
|||||
|
|||||
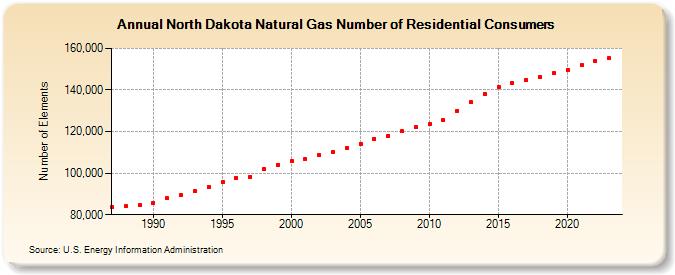
| North Dakota Natural Gas Number of Residential Consumers (Number of Elements) | |||||
| Decade | Year-0 | Year-1 | Year-2 | Year-3 | Year-4 | Year-5 | Year-6 | Year-7 | Year-8 | Year-9 |
|---|---|---|---|---|---|---|---|---|---|---|
| 1980's | 83,517 | 84,059 | 84,643 | |||||||
| 1990's | 85,646 | 87,880 | 89,522 | 91,237 | 93,398 | 95,818 | 97,761 | 98,326 | 101,930 | 104,051 |
| 2000's | 105,660 | 106,758 | 108,716 | 110,048 | 112,206 | 114,152 | 116,615 | 118,100 | 120,056 | 122,065 |
| 2010's | 123,585 | 125,392 | 130,044 | 133,975 | 137,972 | 141,465 | 143,309 | 144,881 | 146,336 | 148,015 |
| 2020's | 149,828 | 152,032 | 154,050 | 155,242 | 158,611 |
| - = No Data Reported; -- = Not Applicable; NA = Not Available; W = Withheld to avoid disclosure of individual company data. |
| Release Date: 6/30/2026 |
| Next Release Date: 7/31/2026 |