|
Download Data (XLS File) |
|
|||||
|
|||||
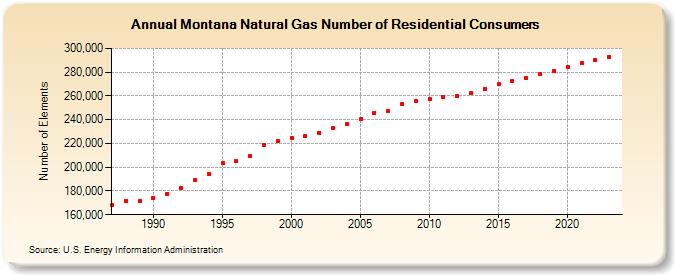
| Montana Natural Gas Number of Residential Consumers (Number of Elements) | |||||
| Decade | Year-0 | Year-1 | Year-2 | Year-3 | Year-4 | Year-5 | Year-6 | Year-7 | Year-8 | Year-9 |
|---|---|---|---|---|---|---|---|---|---|---|
| 1980's | 167,883 | 171,785 | 171,156 | |||||||
| 1990's | 174,384 | 177,726 | 182,641 | 188,879 | 194,357 | 203,435 | 205,199 | 209,806 | 218,851 | 222,114 |
| 2000's | 224,784 | 226,171 | 229,015 | 232,839 | 236,511 | 240,554 | 245,883 | 247,035 | 253,122 | 255,472 |
| 2010's | 257,322 | 259,046 | 259,957 | 262,122 | 265,849 | 269,766 | 272,483 | 275,360 | 278,298 | 281,112 |
| 2020's | 284,373 | 287,380 | 290,199 | 292,800 | 295,415 |
| - = No Data Reported; -- = Not Applicable; NA = Not Available; W = Withheld to avoid disclosure of individual company data. |
| Release Date: 6/30/2026 |
| Next Release Date: 7/31/2026 |