|
Download Data (XLS File) |
|
|||||
|
|||||
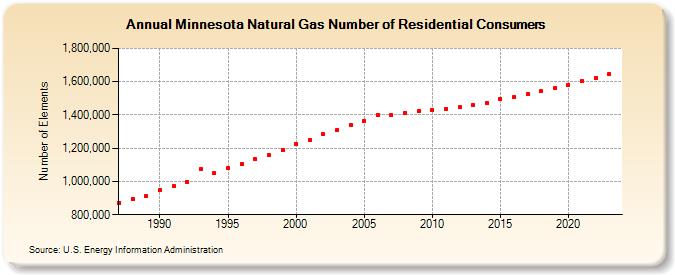
| Minnesota Natural Gas Number of Residential Consumers (Number of Elements) | |||||
| Decade | Year-0 | Year-1 | Year-2 | Year-3 | Year-4 | Year-5 | Year-6 | Year-7 | Year-8 | Year-9 |
|---|---|---|---|---|---|---|---|---|---|---|
| 1980's | 872,148 | 894,380 | 911,001 | |||||||
| 1990's | 946,107 | 970,941 | 998,201 | 1,074,631 | 1,049,263 | 1,080,009 | 1,103,709 | 1,134,019 | 1,161,423 | 1,190,190 |
| 2000's | 1,222,397 | 1,249,748 | 1,282,751 | 1,308,143 | 1,338,061 | 1,364,237 | 1,401,362 | 1,401,623 | 1,413,162 | 1,423,703 |
| 2010's | 1,429,681 | 1,436,063 | 1,445,824 | 1,459,134 | 1,472,663 | 1,496,790 | 1,506,297 | 1,523,997 | 1,543,581 | 1,559,872 |
| 2020's | 1,582,365 | 1,602,690 | 1,624,665 | 1,644,691 | 1,663,597 |
| - = No Data Reported; -- = Not Applicable; NA = Not Available; W = Withheld to avoid disclosure of individual company data. |
| Release Date: 6/30/2026 |
| Next Release Date: 7/31/2026 |