|
Download Data (XLS File) |
|
|||||
|
|||||
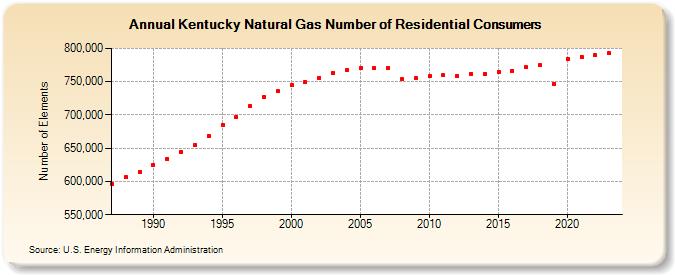
| Kentucky Natural Gas Number of Residential Consumers (Number of Elements) | |||||
| Decade | Year-0 | Year-1 | Year-2 | Year-3 | Year-4 | Year-5 | Year-6 | Year-7 | Year-8 | Year-9 |
|---|---|---|---|---|---|---|---|---|---|---|
| 1980's | 596,320 | 606,106 | 614,058 | |||||||
| 1990's | 624,477 | 633,942 | 644,281 | 654,664 | 668,774 | 685,481 | 696,989 | 713,509 | 726,960 | 735,371 |
| 2000's | 744,816 | 749,106 | 756,234 | 763,290 | 767,022 | 770,080 | 770,171 | 771,047 | 753,531 | 754,761 |
| 2010's | 758,129 | 759,584 | 757,790 | 761,575 | 761,935 | 764,946 | 766,514 | 771,392 | 774,357 | 747,227 |
| 2020's | 784,180 | 787,665 | 789,333 | 793,591 | 795,860 |
| - = No Data Reported; -- = Not Applicable; NA = Not Available; W = Withheld to avoid disclosure of individual company data. |
| Release Date: 6/30/2026 |
| Next Release Date: 7/31/2026 |