|
Download Data (XLS File) |
|
|||||
|
|||||
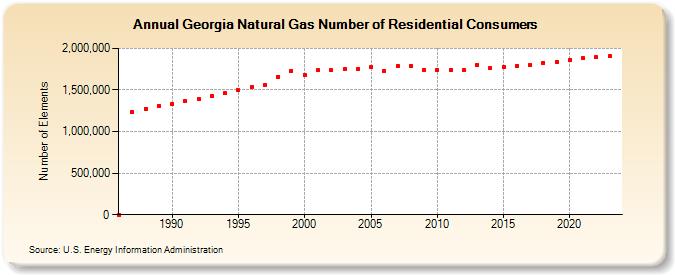
| Georgia Natural Gas Number of Residential Consumers (Number of Elements) | |||||
| Decade | Year-0 | Year-1 | Year-2 | Year-3 | Year-4 | Year-5 | Year-6 | Year-7 | Year-8 | Year-9 |
|---|---|---|---|---|---|---|---|---|---|---|
| 1980's | 1,190 | 1,237,201 | 1,275,128 | 1,308,972 | ||||||
| 1990's | 1,334,935 | 1,363,723 | 1,396,860 | 1,430,626 | 1,460,141 | 1,495,992 | 1,538,458 | 1,553,948 | 1,659,730 | 1,732,865 |
| 2000's | 1,680,749 | 1,737,850 | 1,735,063 | 1,747,017 | 1,752,346 | 1,773,121 | 1,726,239 | 1,793,650 | 1,791,256 | 1,744,934 |
| 2010's | 1,740,587 | 1,740,006 | 1,739,543 | 1,805,425 | 1,759,394 | 1,777,617 | 1,793,371 | 1,804,749 | 1,827,473 | 1,842,099 |
| 2020's | 1,864,109 | 1,881,936 | 1,893,058 | 1,905,963 | 1,915,244 |
| - = No Data Reported; -- = Not Applicable; NA = Not Available; W = Withheld to avoid disclosure of individual company data. |
| Release Date: 6/30/2026 |
| Next Release Date: 7/31/2026 |