|
Download Data (XLS File) |
|
|||||
|
|||||
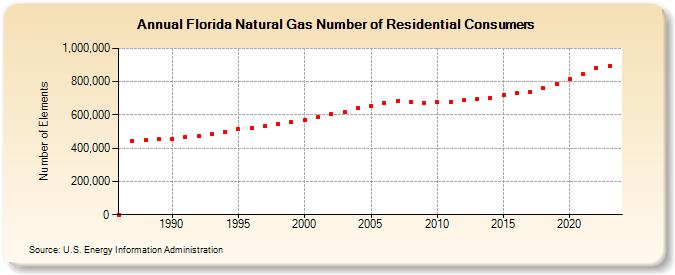
| Florida Natural Gas Number of Residential Consumers (Number of Elements) | |||||
| Decade | Year-0 | Year-1 | Year-2 | Year-3 | Year-4 | Year-5 | Year-6 | Year-7 | Year-8 | Year-9 |
|---|---|---|---|---|---|---|---|---|---|---|
| 1980's | 442 | 444,848 | 446,690 | 452,544 | ||||||
| 1990's | 457,648 | 467,221 | 471,863 | 484,816 | 497,777 | 512,365 | 521,674 | 532,790 | 542,770 | 556,628 |
| 2000's | 571,972 | 590,221 | 603,690 | 617,373 | 639,014 | 656,069 | 673,122 | 682,996 | 679,265 | 674,090 |
| 2010's | 675,551 | 679,199 | 686,994 | 694,210 | 703,535 | 719,475 | 731,744 | 739,730 | 759,925 | 785,502 |
| 2020's | 814,864 | 845,173 | 881,613 | 913,362 | 945,906 |
| - = No Data Reported; -- = Not Applicable; NA = Not Available; W = Withheld to avoid disclosure of individual company data. |
| Release Date: 6/30/2026 |
| Next Release Date: 7/31/2026 |