|
Download Data (XLS File) |
|
|||||
|
|||||
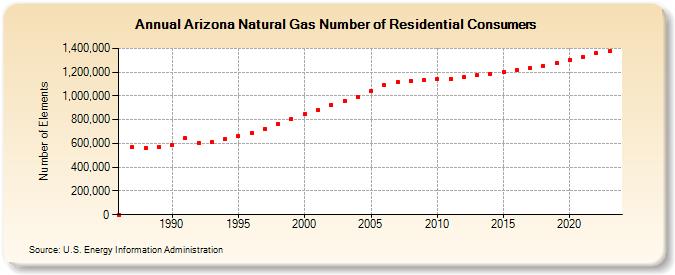
| Arizona Natural Gas Number of Residential Consumers (Number of Elements) | |||||
| Decade | Year-0 | Year-1 | Year-2 | Year-3 | Year-4 | Year-5 | Year-6 | Year-7 | Year-8 | Year-9 |
|---|---|---|---|---|---|---|---|---|---|---|
| 1980's | 545 | 567,962 | 564,195 | 572,461 | ||||||
| 1990's | 586,866 | 642,659 | 604,899 | 610,337 | 635,335 | 661,192 | 689,597 | 724,911 | 764,167 | 802,469 |
| 2000's | 846,016 | 884,789 | 925,927 | 957,442 | 993,885 | 1,042,662 | 1,088,574 | 1,119,266 | 1,128,264 | 1,130,047 |
| 2010's | 1,138,448 | 1,146,286 | 1,157,688 | 1,172,003 | 1,186,794 | 1,200,773 | 1,215,692 | 1,234,912 | 1,252,498 | 1,277,421 |
| 2020's | 1,306,008 | 1,330,138 | 1,358,116 | 1,376,396 | 1,395,584 |
| - = No Data Reported; -- = Not Applicable; NA = Not Available; W = Withheld to avoid disclosure of individual company data. |
| Release Date: 6/30/2026 |
| Next Release Date: 7/31/2026 |