|
Download Data (XLS File) |
|
|||||
|
|||||
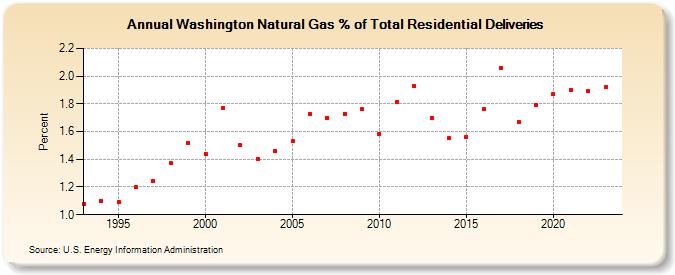
| Washington Natural Gas % of Total Residential Deliveries (Percent) | |||||
| Decade | Year-0 | Year-1 | Year-2 | Year-3 | Year-4 | Year-5 | Year-6 | Year-7 | Year-8 | Year-9 |
|---|---|---|---|---|---|---|---|---|---|---|
| 1990's | 1.08 | 1.10 | 1.09 | 1.20 | 1.24 | 1.37 | 1.52 | |||
| 2000's | 1.44 | 1.77 | 1.50 | 1.40 | 1.46 | 1.53 | 1.73 | 1.70 | 1.73 | 1.76 |
| 2010's | 1.58 | 1.81 | 1.93 | 1.70 | 1.55 | 1.56 | 1.76 | 2.06 | 1.67 | 1.79 |
| 2020's | 1.87 | 1.90 | 1.89 | 1.92 | 1.93 |
| - = No Data Reported; -- = Not Applicable; NA = Not Available; W = Withheld to avoid disclosure of individual company data. |
| Release Date: 5/29/2026 |
| Next Release Date: 6/30/2026 |