|
Download Data (XLS File) |
|
|||||
|
|||||
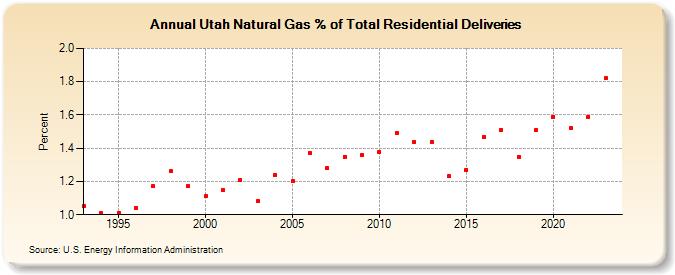
| Utah Natural Gas % of Total Residential Deliveries (Percent) | |||||
| Decade | Year-0 | Year-1 | Year-2 | Year-3 | Year-4 | Year-5 | Year-6 | Year-7 | Year-8 | Year-9 |
|---|---|---|---|---|---|---|---|---|---|---|
| 1990's | 1.05 | 1.01 | 1.01 | 1.04 | 1.17 | 1.26 | 1.17 | |||
| 2000's | 1.11 | 1.15 | 1.21 | 1.08 | 1.24 | 1.20 | 1.37 | 1.28 | 1.35 | 1.36 |
| 2010's | 1.38 | 1.49 | 1.44 | 1.44 | 1.23 | 1.27 | 1.47 | 1.51 | 1.35 | 1.51 |
| 2020's | 1.59 | 1.52 | 1.59 | 1.82 | 1.69 |
| - = No Data Reported; -- = Not Applicable; NA = Not Available; W = Withheld to avoid disclosure of individual company data. |
| Release Date: 5/29/2026 |
| Next Release Date: 6/30/2026 |