|
Download Data (XLS File) |
|
|||||
|
|||||
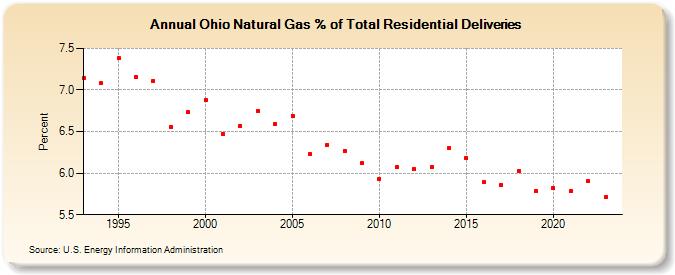
| Ohio Natural Gas % of Total Residential Deliveries (Percent) | |||||
| Decade | Year-0 | Year-1 | Year-2 | Year-3 | Year-4 | Year-5 | Year-6 | Year-7 | Year-8 | Year-9 |
|---|---|---|---|---|---|---|---|---|---|---|
| 1990's | 7.14 | 7.08 | 7.38 | 7.15 | 7.11 | 6.56 | 6.73 | |||
| 2000's | 6.88 | 6.47 | 6.57 | 6.75 | 6.59 | 6.69 | 6.23 | 6.34 | 6.27 | 6.12 |
| 2010's | 5.93 | 6.07 | 6.05 | 6.07 | 6.30 | 6.18 | 5.89 | 5.86 | 6.03 | 5.78 |
| 2020's | 5.82 | 5.78 | 5.90 | 5.71 | 5.63 |
| - = No Data Reported; -- = Not Applicable; NA = Not Available; W = Withheld to avoid disclosure of individual company data. |
| Release Date: 11/28/2025 |
| Next Release Date: 12/31/2025 |