|
Download Data (XLS File) |
|
|||||
|
|||||
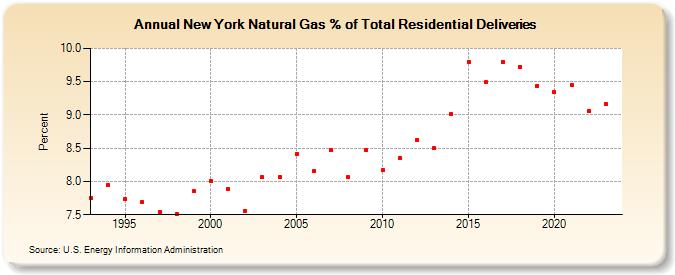
| New York Natural Gas % of Total Residential Deliveries (Percent) | |||||
| Decade | Year-0 | Year-1 | Year-2 | Year-3 | Year-4 | Year-5 | Year-6 | Year-7 | Year-8 | Year-9 |
|---|---|---|---|---|---|---|---|---|---|---|
| 1990's | 7.75 | 7.95 | 7.73 | 7.69 | 7.54 | 7.51 | 7.85 | |||
| 2000's | 8.01 | 7.88 | 7.56 | 8.06 | 8.07 | 8.42 | 8.16 | 8.48 | 8.06 | 8.47 |
| 2010's | 8.17 | 8.35 | 8.62 | 8.50 | 9.01 | 9.80 | 9.49 | 9.80 | 9.72 | 9.44 |
| 2020's | 9.35 | 9.45 | 9.06 | 9.17 | 9.12 |
| - = No Data Reported; -- = Not Applicable; NA = Not Available; W = Withheld to avoid disclosure of individual company data. |
| Release Date: 11/28/2025 |
| Next Release Date: 12/31/2025 |