|
Download Data (XLS File) |
|
|||||
|
|||||
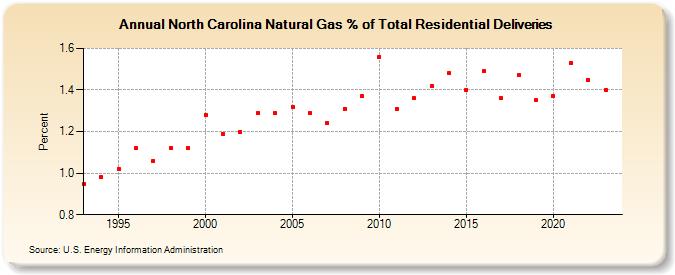
| North Carolina Natural Gas % of Total Residential Deliveries (Percent) | |||||
| Decade | Year-0 | Year-1 | Year-2 | Year-3 | Year-4 | Year-5 | Year-6 | Year-7 | Year-8 | Year-9 |
|---|---|---|---|---|---|---|---|---|---|---|
| 1990's | 0.95 | 0.98 | 1.02 | 1.12 | 1.06 | 1.12 | 1.12 | |||
| 2000's | 1.28 | 1.19 | 1.20 | 1.29 | 1.29 | 1.32 | 1.29 | 1.24 | 1.31 | 1.37 |
| 2010's | 1.56 | 1.31 | 1.36 | 1.42 | 1.48 | 1.40 | 1.49 | 1.36 | 1.47 | 1.35 |
| 2020's | 1.37 | 1.53 | 1.45 | 1.40 | 1.57 |
| - = No Data Reported; -- = Not Applicable; NA = Not Available; W = Withheld to avoid disclosure of individual company data. |
| Release Date: 5/29/2026 |
| Next Release Date: 6/30/2026 |