|
Download Data (XLS File) |
|
|||||
|
|||||
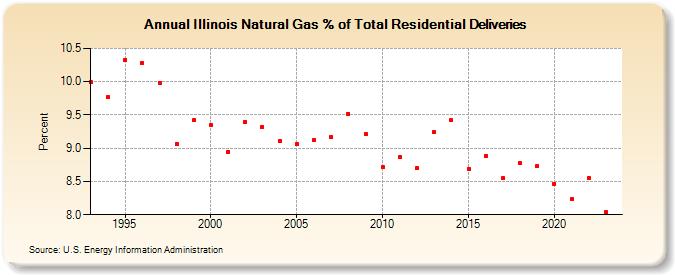
| Illinois Natural Gas % of Total Residential Deliveries (Percent) | |||||
| Decade | Year-0 | Year-1 | Year-2 | Year-3 | Year-4 | Year-5 | Year-6 | Year-7 | Year-8 | Year-9 |
|---|---|---|---|---|---|---|---|---|---|---|
| 1990's | 9.99 | 9.77 | 10.33 | 10.28 | 9.98 | 9.07 | 9.42 | |||
| 2000's | 9.35 | 8.95 | 9.40 | 9.32 | 9.11 | 9.07 | 9.12 | 9.17 | 9.52 | 9.21 |
| 2010's | 8.71 | 8.87 | 8.70 | 9.24 | 9.42 | 8.69 | 8.89 | 8.55 | 8.77 | 8.73 |
| 2020's | 8.46 | 8.23 | 8.55 | 8.04 | 7.85 |
| - = No Data Reported; -- = Not Applicable; NA = Not Available; W = Withheld to avoid disclosure of individual company data. |
| Release Date: 5/29/2026 |
| Next Release Date: 6/30/2026 |