|
Download Data (XLS File) |
|
|||||
|
|||||
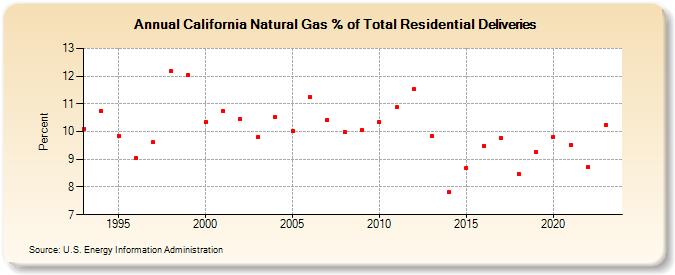
| California Natural Gas % of Total Residential Deliveries (Percent) | |||||
| Decade | Year-0 | Year-1 | Year-2 | Year-3 | Year-4 | Year-5 | Year-6 | Year-7 | Year-8 | Year-9 |
|---|---|---|---|---|---|---|---|---|---|---|
| 1990's | 10.11 | 10.75 | 9.85 | 9.03 | 9.61 | 12.17 | 12.03 | |||
| 2000's | 10.34 | 10.75 | 10.45 | 9.80 | 10.52 | 10.02 | 11.26 | 10.43 | 10.00 | 10.06 |
| 2010's | 10.35 | 10.87 | 11.52 | 9.84 | 7.81 | 8.70 | 9.48 | 9.77 | 8.48 | 9.26 |
| 2020's | 9.81 | 9.53 | 8.72 | 10.24 | 9.56 |
| - = No Data Reported; -- = Not Applicable; NA = Not Available; W = Withheld to avoid disclosure of individual company data. |
| Release Date: 5/29/2026 |
| Next Release Date: 6/30/2026 |