|
Download Data (XLS File) |
|
|||||
|
|||||
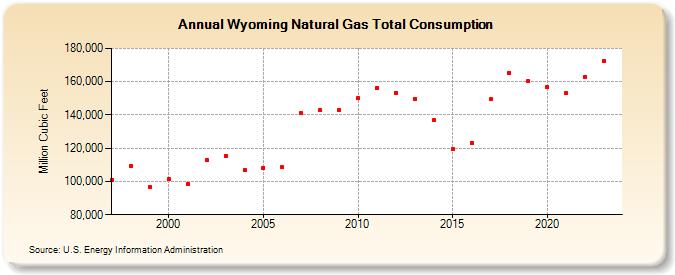
| Wyoming Natural Gas Total Consumption (Million Cubic Feet) | |||||
| Decade | Year-0 | Year-1 | Year-2 | Year-3 | Year-4 | Year-5 | Year-6 | Year-7 | Year-8 | Year-9 |
|---|---|---|---|---|---|---|---|---|---|---|
| 1990's | 100,950 | 109,188 | 96,726 | |||||||
| 2000's | 101,314 | 98,569 | 112,872 | 115,358 | 107,060 | 108,314 | 108,481 | 140,912 | 142,705 | 142,793 |
| 2010's | 150,106 | 156,455 | 153,333 | 149,820 | 136,796 | 119,265 | 123,351 | 149,405 | 165,384 | 160,366 |
| 2020's | 156,838 | 153,013 | 162,997 | 171,860 | 210,846 |
| - = No Data Reported; -- = Not Applicable; NA = Not Available; W = Withheld to avoid disclosure of individual company data. |
| Release Date: 6/30/2026 |
| Next Release Date: 7/31/2026 |