|
Download Data (XLS File) |
|
|||||
|
|||||
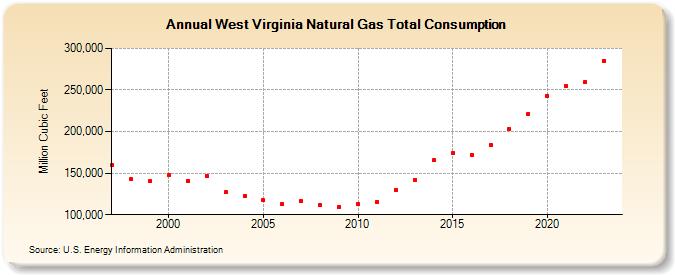
| West Virginia Natural Gas Total Consumption (Million Cubic Feet) | |||||
| Decade | Year-0 | Year-1 | Year-2 | Year-3 | Year-4 | Year-5 | Year-6 | Year-7 | Year-8 | Year-9 |
|---|---|---|---|---|---|---|---|---|---|---|
| 1990's | 159,504 | 142,860 | 139,961 | |||||||
| 2000's | 147,854 | 141,090 | 146,455 | 126,986 | 122,267 | 117,136 | 113,084 | 115,974 | 111,480 | 109,652 |
| 2010's | 113,179 | 115,361 | 129,753 | 142,082 | 165,341 | 174,165 | 171,825 | 184,025 | 202,934 | 221,268 |
| 2020's | 243,116 | 255,067 | 259,352 | 285,542 | 298,884 |
| - = No Data Reported; -- = Not Applicable; NA = Not Available; W = Withheld to avoid disclosure of individual company data. |
| Release Date: 6/30/2026 |
| Next Release Date: 7/31/2026 |