|
Download Data (XLS File) |
|
|||||
|
|||||
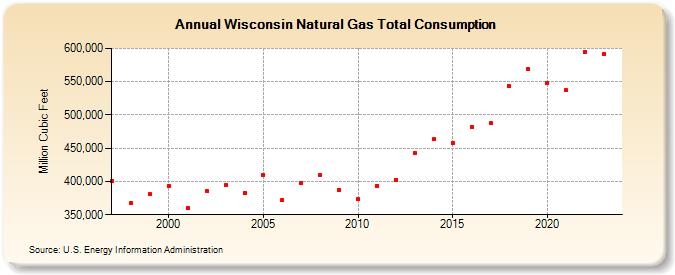
| Wisconsin Natural Gas Total Consumption (Million Cubic Feet) | |||||
| Decade | Year-0 | Year-1 | Year-2 | Year-3 | Year-4 | Year-5 | Year-6 | Year-7 | Year-8 | Year-9 |
|---|---|---|---|---|---|---|---|---|---|---|
| 1990's | 400,651 | 368,022 | 380,560 | |||||||
| 2000's | 393,601 | 359,784 | 385,310 | 394,711 | 383,316 | 410,250 | 372,462 | 398,370 | 409,377 | 387,066 |
| 2010's | 372,898 | 393,734 | 402,656 | 442,544 | 463,186 | 457,743 | 482,233 | 487,732 | 543,025 | 568,646 |
| 2020's | 547,716 | 536,914 | 594,784 | 571,611 | 563,773 |
| - = No Data Reported; -- = Not Applicable; NA = Not Available; W = Withheld to avoid disclosure of individual company data. |
| Release Date: 6/30/2026 |
| Next Release Date: 7/31/2026 |