|
Download Data (XLS File) |
|
|||||
|
|||||
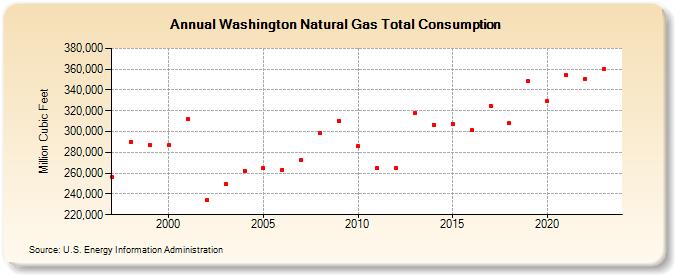
| Washington Natural Gas Total Consumption (Million Cubic Feet) | |||||
| Decade | Year-0 | Year-1 | Year-2 | Year-3 | Year-4 | Year-5 | Year-6 | Year-7 | Year-8 | Year-9 |
|---|---|---|---|---|---|---|---|---|---|---|
| 1990's | 256,366 | 290,229 | 287,302 | |||||||
| 2000's | 286,653 | 312,114 | 233,716 | 249,599 | 262,485 | 264,754 | 263,395 | 272,613 | 298,140 | 310,428 |
| 2010's | 285,726 | 264,589 | 264,540 | 318,292 | 306,675 | 307,735 | 301,418 | 324,882 | 307,985 | 348,265 |
| 2020's | 328,963 | 354,300 | 350,998 | 371,980 | 362,162 |
| - = No Data Reported; -- = Not Applicable; NA = Not Available; W = Withheld to avoid disclosure of individual company data. |
| Release Date: 6/30/2026 |
| Next Release Date: 7/31/2026 |