|
Download Data (XLS File) |
|
|||||
|
|||||
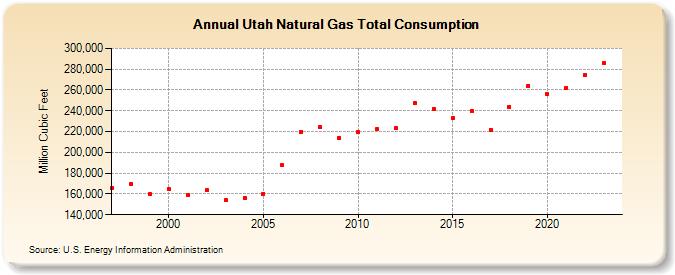
| Utah Natural Gas Total Consumption (Million Cubic Feet) | |||||
| Decade | Year-0 | Year-1 | Year-2 | Year-3 | Year-4 | Year-5 | Year-6 | Year-7 | Year-8 | Year-9 |
|---|---|---|---|---|---|---|---|---|---|---|
| 1990's | 165,253 | 169,776 | 159,889 | |||||||
| 2000's | 164,557 | 159,299 | 163,379 | 154,125 | 155,891 | 160,275 | 187,399 | 219,700 | 224,188 | 214,220 |
| 2010's | 219,213 | 222,227 | 223,039 | 247,285 | 241,737 | 232,612 | 240,114 | 221,834 | 244,058 | 264,301 |
| 2020's | 255,851 | 262,353 | 274,714 | 287,344 | 276,500 |
| - = No Data Reported; -- = Not Applicable; NA = Not Available; W = Withheld to avoid disclosure of individual company data. |
| Release Date: 6/30/2026 |
| Next Release Date: 7/31/2026 |