|
Download Data (XLS File) |
|
|||||
|
|||||
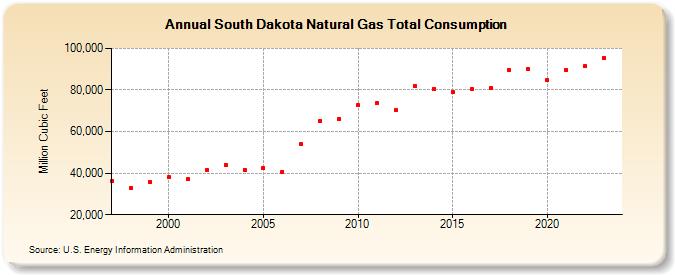
| South Dakota Natural Gas Total Consumption (Million Cubic Feet) | |||||
| Decade | Year-0 | Year-1 | Year-2 | Year-3 | Year-4 | Year-5 | Year-6 | Year-7 | Year-8 | Year-9 |
|---|---|---|---|---|---|---|---|---|---|---|
| 1990's | 36,115 | 33,042 | 35,794 | |||||||
| 2000's | 37,939 | 37,077 | 41,577 | 43,881 | 41,679 | 42,555 | 40,739 | 53,938 | 65,258 | 66,185 |
| 2010's | 72,563 | 73,605 | 70,238 | 81,986 | 80,613 | 79,099 | 80,513 | 80,890 | 89,464 | 89,879 |
| 2020's | 84,630 | 89,616 | 91,346 | 94,886 | 95,165 |
| - = No Data Reported; -- = Not Applicable; NA = Not Available; W = Withheld to avoid disclosure of individual company data. |
| Release Date: 6/30/2026 |
| Next Release Date: 7/31/2026 |