|
Download Data (XLS File) |
|
|||||
|
|||||
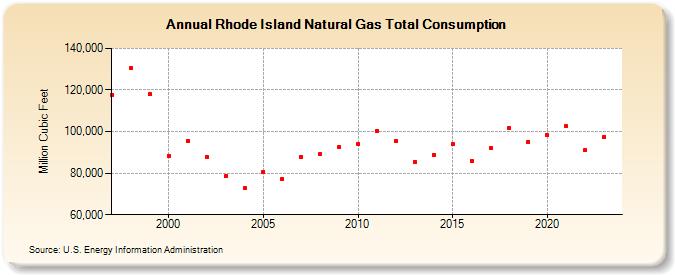
| Rhode Island Natural Gas Total Consumption (Million Cubic Feet) | |||||
| Decade | Year-0 | Year-1 | Year-2 | Year-3 | Year-4 | Year-5 | Year-6 | Year-7 | Year-8 | Year-9 |
|---|---|---|---|---|---|---|---|---|---|---|
| 1990's | 117,707 | 130,751 | 118,001 | |||||||
| 2000's | 88,419 | 95,607 | 87,805 | 78,456 | 72,609 | 80,764 | 77,204 | 87,972 | 89,256 | 92,743 |
| 2010's | 94,110 | 100,455 | 95,476 | 85,537 | 88,886 | 93,886 | 85,977 | 92,061 | 101,796 | 95,170 |
| 2020's | 98,140 | 102,501 | 91,096 | 109,434 | 104,533 |
| - = No Data Reported; -- = Not Applicable; NA = Not Available; W = Withheld to avoid disclosure of individual company data. |
| Release Date: 6/30/2026 |
| Next Release Date: 7/31/2026 |