|
Download Data (XLS File) |
|
|||||
|
|||||
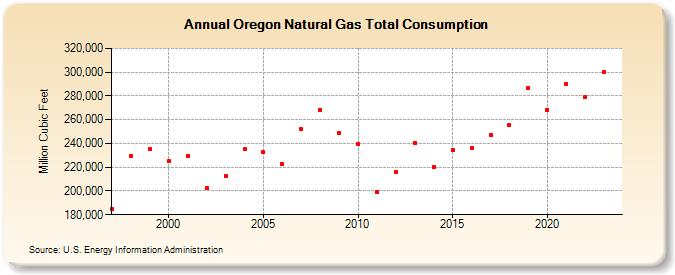
| Oregon Natural Gas Total Consumption (Million Cubic Feet) | |||||
| Decade | Year-0 | Year-1 | Year-2 | Year-3 | Year-4 | Year-5 | Year-6 | Year-7 | Year-8 | Year-9 |
|---|---|---|---|---|---|---|---|---|---|---|
| 1990's | 185,069 | 229,403 | 235,009 | |||||||
| 2000's | 224,888 | 229,665 | 202,164 | 212,556 | 234,997 | 232,562 | 222,608 | 251,927 | 268,484 | 248,864 |
| 2010's | 239,325 | 199,419 | 215,830 | 240,418 | 220,090 | 234,634 | 235,912 | 247,206 | 255,713 | 287,017 |
| 2020's | 268,298 | 289,730 | 279,166 | 306,488 | 313,947 |
| - = No Data Reported; -- = Not Applicable; NA = Not Available; W = Withheld to avoid disclosure of individual company data. |
| Release Date: 6/30/2026 |
| Next Release Date: 7/31/2026 |