|
Download Data (XLS File) |
|
|||||
|
|||||
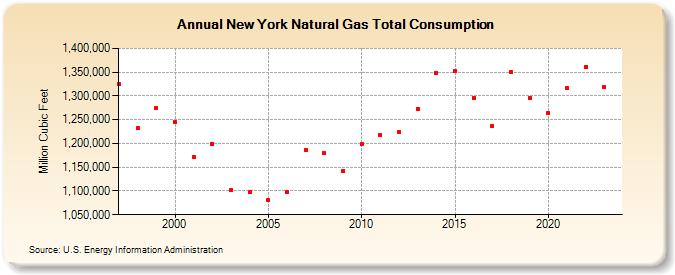
| New York Natural Gas Total Consumption (Million Cubic Feet) | |||||
| Decade | Year-0 | Year-1 | Year-2 | Year-3 | Year-4 | Year-5 | Year-6 | Year-7 | Year-8 | Year-9 |
|---|---|---|---|---|---|---|---|---|---|---|
| 1990's | 1,324,164 | 1,232,473 | 1,274,162 | |||||||
| 2000's | 1,244,746 | 1,171,898 | 1,199,632 | 1,101,618 | 1,098,056 | 1,080,215 | 1,097,160 | 1,187,059 | 1,180,356 | 1,142,625 |
| 2010's | 1,198,127 | 1,217,324 | 1,223,036 | 1,273,263 | 1,349,203 | 1,353,385 | 1,296,270 | 1,237,311 | 1,350,443 | 1,296,268 |
| 2020's | 1,263,584 | 1,317,285 | 1,361,023 | 1,305,286 | 1,324,883 |
| - = No Data Reported; -- = Not Applicable; NA = Not Available; W = Withheld to avoid disclosure of individual company data. |
| Release Date: 6/30/2026 |
| Next Release Date: 7/31/2026 |