|
Download Data (XLS File) |
|
|||||
|
|||||
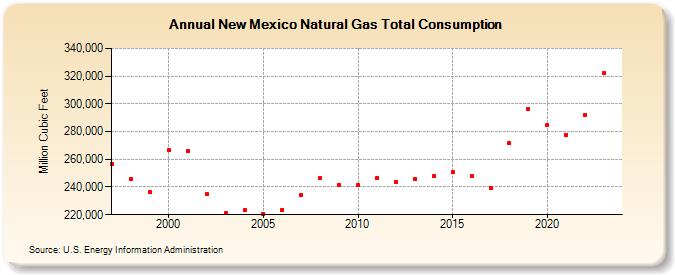
| New Mexico Natural Gas Total Consumption (Million Cubic Feet) | |||||
| Decade | Year-0 | Year-1 | Year-2 | Year-3 | Year-4 | Year-5 | Year-6 | Year-7 | Year-8 | Year-9 |
|---|---|---|---|---|---|---|---|---|---|---|
| 1990's | 256,464 | 245,823 | 236,264 | |||||||
| 2000's | 266,469 | 266,283 | 235,098 | 221,021 | 223,575 | 220,717 | 223,636 | 234,236 | 246,665 | 241,194 |
| 2010's | 241,137 | 246,418 | 243,961 | 245,502 | 247,637 | 250,518 | 247,761 | 239,305 | 271,547 | 296,352 |
| 2020's | 284,656 | 277,216 | 292,220 | 327,152 | 311,685 |
| - = No Data Reported; -- = Not Applicable; NA = Not Available; W = Withheld to avoid disclosure of individual company data. |
| Release Date: 6/30/2026 |
| Next Release Date: 7/31/2026 |