|
Download Data (XLS File) |
|
|||||
|
|||||
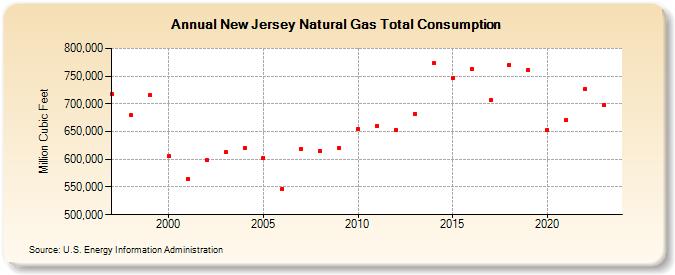
| New Jersey Natural Gas Total Consumption (Million Cubic Feet) | |||||
| Decade | Year-0 | Year-1 | Year-2 | Year-3 | Year-4 | Year-5 | Year-6 | Year-7 | Year-8 | Year-9 |
|---|---|---|---|---|---|---|---|---|---|---|
| 1990's | 717,011 | 679,619 | 715,630 | |||||||
| 2000's | 605,275 | 564,923 | 598,602 | 612,890 | 620,806 | 602,388 | 547,206 | 618,965 | 614,908 | 620,790 |
| 2010's | 654,458 | 660,743 | 652,060 | 682,247 | 773,221 | 745,789 | 762,958 | 706,589 | 770,284 | 761,005 |
| 2020's | 653,447 | 671,501 | 727,407 | 694,877 | 655,438 |
| - = No Data Reported; -- = Not Applicable; NA = Not Available; W = Withheld to avoid disclosure of individual company data. |
| Release Date: 6/30/2026 |
| Next Release Date: 7/31/2026 |