|
Download Data (XLS File) |
|
|||||
|
|||||
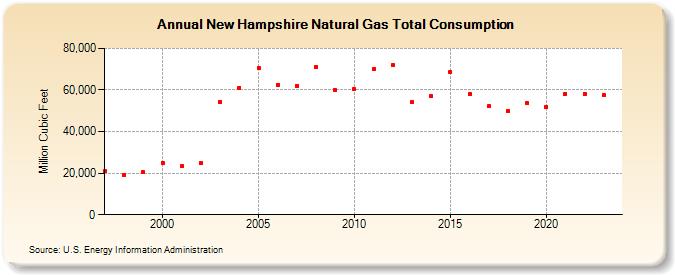
| New Hampshire Natural Gas Total Consumption (Million Cubic Feet) | |||||
| Decade | Year-0 | Year-1 | Year-2 | Year-3 | Year-4 | Year-5 | Year-6 | Year-7 | Year-8 | Year-9 |
|---|---|---|---|---|---|---|---|---|---|---|
| 1990's | 20,848 | 19,127 | 20,313 | |||||||
| 2000's | 24,950 | 23,398 | 24,901 | 54,147 | 61,172 | 70,484 | 62,549 | 62,132 | 71,179 | 59,950 |
| 2010's | 60,378 | 69,978 | 72,032 | 54,028 | 57,018 | 68,682 | 57,957 | 52,071 | 49,888 | 53,650 |
| 2020's | 51,966 | 58,252 | 58,196 | 57,685 | 57,678 |
| - = No Data Reported; -- = Not Applicable; NA = Not Available; W = Withheld to avoid disclosure of individual company data. |
| Release Date: 6/30/2026 |
| Next Release Date: 7/31/2026 |