|
Download Data (XLS File) |
|
|||||
|
|||||
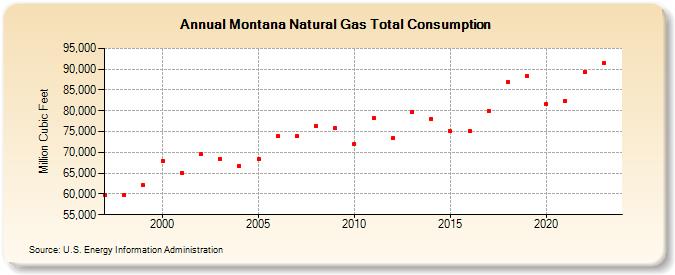
| Montana Natural Gas Total Consumption (Million Cubic Feet) | |||||
| Decade | Year-0 | Year-1 | Year-2 | Year-3 | Year-4 | Year-5 | Year-6 | Year-7 | Year-8 | Year-9 |
|---|---|---|---|---|---|---|---|---|---|---|
| 1990's | 59,851 | 59,840 | 62,129 | |||||||
| 2000's | 67,955 | 65,051 | 69,532 | 68,473 | 66,829 | 68,355 | 73,879 | 73,822 | 76,422 | 75,802 |
| 2010's | 72,025 | 78,217 | 73,399 | 79,670 | 78,110 | 75,042 | 75,037 | 80,036 | 87,034 | 88,321 |
| 2020's | 81,606 | 82,408 | 89,411 | 91,485 | 89,235 |
| - = No Data Reported; -- = Not Applicable; NA = Not Available; W = Withheld to avoid disclosure of individual company data. |
| Release Date: 6/30/2026 |
| Next Release Date: 7/31/2026 |