|
Download Data (XLS File) |
|
|||||
|
|||||
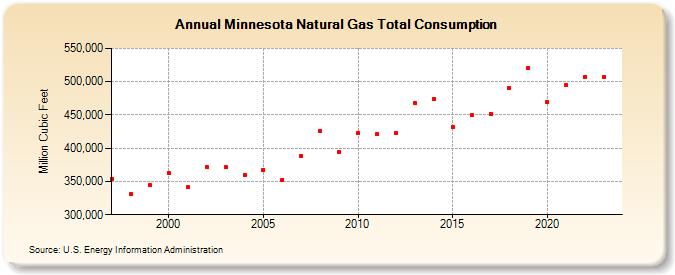
| Minnesota Natural Gas Total Consumption (Million Cubic Feet) | |||||
| Decade | Year-0 | Year-1 | Year-2 | Year-3 | Year-4 | Year-5 | Year-6 | Year-7 | Year-8 | Year-9 |
|---|---|---|---|---|---|---|---|---|---|---|
| 1990's | 354,092 | 330,513 | 344,591 | |||||||
| 2000's | 362,025 | 340,911 | 371,583 | 371,261 | 359,898 | 367,825 | 352,570 | 388,335 | 425,352 | 394,136 |
| 2010's | 422,968 | 420,770 | 422,263 | 467,874 | 474,520 | 431,315 | 449,783 | 451,979 | 490,169 | 520,463 |
| 2020's | 468,846 | 495,125 | 507,622 | 506,281 | 496,871 |
| - = No Data Reported; -- = Not Applicable; NA = Not Available; W = Withheld to avoid disclosure of individual company data. |
| Release Date: 6/30/2026 |
| Next Release Date: 7/31/2026 |