|
Download Data (XLS File) |
|
|||||
|
|||||
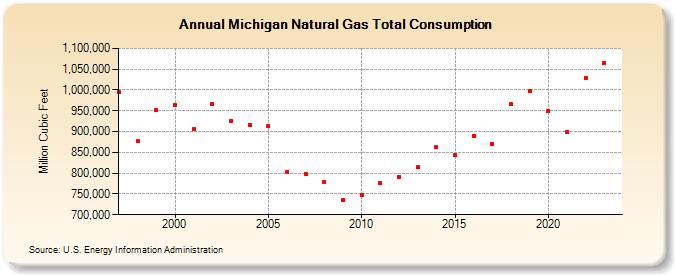
| Michigan Natural Gas Total Consumption (Million Cubic Feet) | |||||
| Decade | Year-0 | Year-1 | Year-2 | Year-3 | Year-4 | Year-5 | Year-6 | Year-7 | Year-8 | Year-9 |
|---|---|---|---|---|---|---|---|---|---|---|
| 1990's | 994,342 | 876,444 | 951,143 | |||||||
| 2000's | 963,136 | 906,001 | 966,354 | 924,819 | 916,629 | 913,827 | 803,336 | 798,126 | 779,602 | 735,340 |
| 2010's | 746,748 | 776,466 | 790,642 | 814,635 | 861,755 | 844,801 | 890,324 | 870,756 | 965,538 | 998,093 |
| 2020's | 948,258 | 899,115 | 1,029,603 | 1,047,422 | 1,031,235 |
| - = No Data Reported; -- = Not Applicable; NA = Not Available; W = Withheld to avoid disclosure of individual company data. |
| Release Date: 6/30/2026 |
| Next Release Date: 7/31/2026 |