|
Download Data (XLS File) |
|
|||||
|
|||||
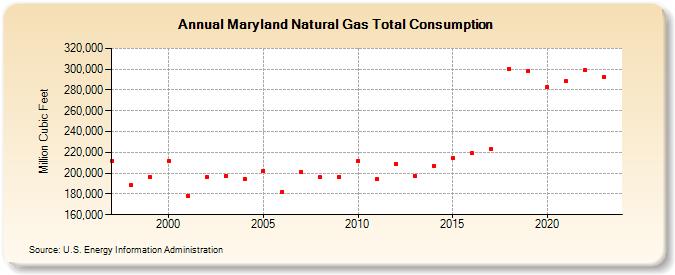
| Maryland Natural Gas Total Consumption (Million Cubic Feet) | |||||
| Decade | Year-0 | Year-1 | Year-2 | Year-3 | Year-4 | Year-5 | Year-6 | Year-7 | Year-8 | Year-9 |
|---|---|---|---|---|---|---|---|---|---|---|
| 1990's | 212,017 | 188,552 | 196,350 | |||||||
| 2000's | 212,133 | 178,376 | 196,276 | 197,024 | 194,725 | 202,509 | 182,294 | 201,053 | 196,067 | 196,510 |
| 2010's | 212,020 | 193,986 | 208,946 | 197,356 | 207,103 | 215,005 | 219,024 | 222,881 | 300,637 | 298,599 |
| 2020's | 282,843 | 288,203 | 298,893 | 293,432 | 291,171 |
| - = No Data Reported; -- = Not Applicable; NA = Not Available; W = Withheld to avoid disclosure of individual company data. |
| Release Date: 6/30/2026 |
| Next Release Date: 7/31/2026 |