|
Download Data (XLS File) |
|
|||||
|
|||||
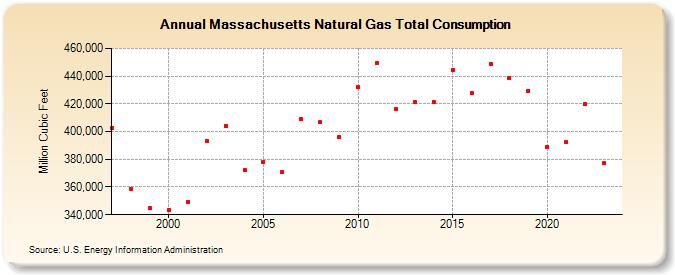
| Massachusetts Natural Gas Total Consumption (Million Cubic Feet) | |||||
| Decade | Year-0 | Year-1 | Year-2 | Year-3 | Year-4 | Year-5 | Year-6 | Year-7 | Year-8 | Year-9 |
|---|---|---|---|---|---|---|---|---|---|---|
| 1990's | 402,629 | 358,846 | 344,790 | |||||||
| 2000's | 343,314 | 349,103 | 393,194 | 403,991 | 372,532 | 378,068 | 370,664 | 408,704 | 406,719 | 395,852 |
| 2010's | 432,297 | 449,194 | 416,350 | 421,001 | 421,671 | 444,332 | 427,946 | 448,996 | 438,577 | 429,515 |
| 2020's | 389,013 | 392,539 | 419,865 | 375,691 | 387,518 |
| - = No Data Reported; -- = Not Applicable; NA = Not Available; W = Withheld to avoid disclosure of individual company data. |
| Release Date: 6/30/2026 |
| Next Release Date: 7/31/2026 |