|
Download Data (XLS File) |
|
|||||
|
|||||
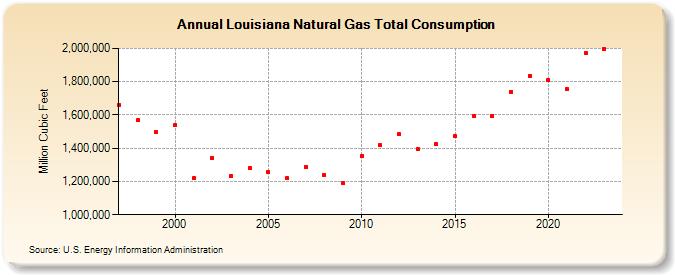
| Louisiana Natural Gas Total Consumption (Million Cubic Feet) | |||||
| Decade | Year-0 | Year-1 | Year-2 | Year-3 | Year-4 | Year-5 | Year-6 | Year-7 | Year-8 | Year-9 |
|---|---|---|---|---|---|---|---|---|---|---|
| 1990's | 1,661,061 | 1,569,190 | 1,495,478 | |||||||
| 2000's | 1,536,725 | 1,219,013 | 1,341,444 | 1,233,505 | 1,281,428 | 1,254,370 | 1,217,871 | 1,289,421 | 1,238,661 | 1,189,744 |
| 2010's | 1,354,641 | 1,420,264 | 1,482,343 | 1,396,261 | 1,423,424 | 1,470,354 | 1,591,882 | 1,593,181 | 1,738,734 | 1,834,142 |
| 2020's | 1,810,716 | 1,753,246 | 1,973,017 | 1,991,829 | 2,025,412 |
| - = No Data Reported; -- = Not Applicable; NA = Not Available; W = Withheld to avoid disclosure of individual company data. |
| Release Date: 6/30/2026 |
| Next Release Date: 7/31/2026 |