|
Download Data (XLS File) |
|
|||||
|
|||||
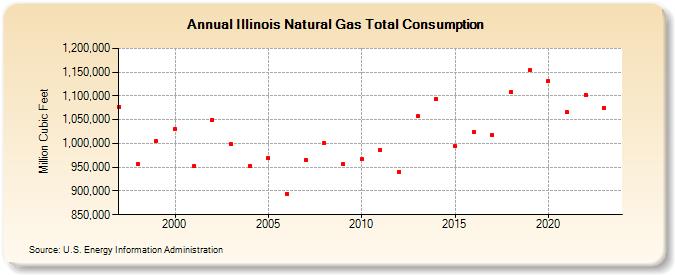
| Illinois Natural Gas Total Consumption (Million Cubic Feet) | |||||
| Decade | Year-0 | Year-1 | Year-2 | Year-3 | Year-4 | Year-5 | Year-6 | Year-7 | Year-8 | Year-9 |
|---|---|---|---|---|---|---|---|---|---|---|
| 1990's | 1,077,139 | 957,254 | 1,004,281 | |||||||
| 2000's | 1,030,604 | 951,616 | 1,049,878 | 998,486 | 953,207 | 969,642 | 893,997 | 965,591 | 1,000,501 | 956,068 |
| 2010's | 966,678 | 986,867 | 940,367 | 1,056,826 | 1,093,931 | 993,548 | 1,024,186 | 1,017,772 | 1,108,592 | 1,153,918 |
| 2020's | 1,130,765 | 1,065,372 | 1,102,618 | 1,068,470 | 1,039,519 |
| - = No Data Reported; -- = Not Applicable; NA = Not Available; W = Withheld to avoid disclosure of individual company data. |
| Release Date: 5/29/2026 |
| Next Release Date: 6/30/2026 |