|
Download Data (XLS File) |
|
|||||
|
|||||
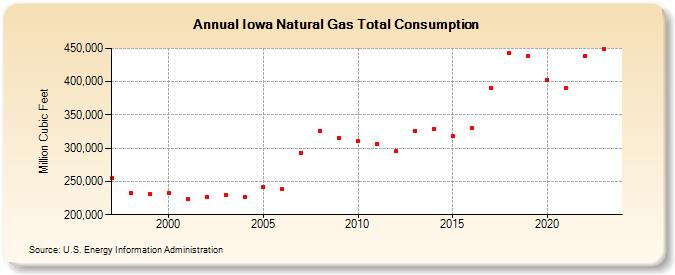
| Iowa Natural Gas Total Consumption (Million Cubic Feet) | |||||
| Decade | Year-0 | Year-1 | Year-2 | Year-3 | Year-4 | Year-5 | Year-6 | Year-7 | Year-8 | Year-9 |
|---|---|---|---|---|---|---|---|---|---|---|
| 1990's | 254,489 | 232,057 | 230,691 | |||||||
| 2000's | 232,565 | 224,336 | 226,457 | 230,161 | 226,819 | 241,340 | 238,454 | 293,274 | 325,772 | 315,186 |
| 2010's | 311,075 | 306,909 | 295,183 | 326,140 | 329,385 | 317,821 | 330,094 | 391,129 | 443,174 | 438,038 |
| 2020's | 403,227 | 390,443 | 439,105 | 441,933 | 433,450 |
| - = No Data Reported; -- = Not Applicable; NA = Not Available; W = Withheld to avoid disclosure of individual company data. |
| Release Date: 6/30/2026 |
| Next Release Date: 7/31/2026 |