|
Download Data (XLS File) |
|
|||||
|
|||||
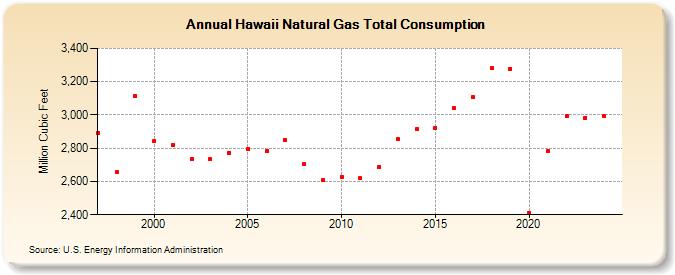
| Hawaii Natural Gas Total Consumption (Million Cubic Feet) | |||||
| Decade | Year-0 | Year-1 | Year-2 | Year-3 | Year-4 | Year-5 | Year-6 | Year-7 | Year-8 | Year-9 |
|---|---|---|---|---|---|---|---|---|---|---|
| 1990's | 2,894 | 2,654 | 3,115 | |||||||
| 2000's | 2,841 | 2,818 | 2,734 | 2,732 | 2,774 | 2,795 | 2,783 | 2,850 | 2,702 | 2,607 |
| 2010's | 2,627 | 2,619 | 2,689 | 2,855 | 2,916 | 2,924 | 3,040 | 3,106 | 3,282 | 3,277 |
| 2020's | 2,413 | 2,783 | 2,993 | 2,983 | 2,994 |
| - = No Data Reported; -- = Not Applicable; NA = Not Available; W = Withheld to avoid disclosure of individual company data. |
| Release Date: 6/30/2026 |
| Next Release Date: 7/31/2026 |